A/B testing is the backbone of data-driven decision making. But running experiments at product scale is very different from testing two button colors on a landing page.
When millions of users, hundreds of metrics, and long-term outcomes are on the line, experimentation becomes both a science and an art.
At Meta, our philosophy was simple:
“If it moves, measure it. If it’s measurable, experiment with it.”
Behind that principle sits a framework designed to ensure experiments are run responsibly, reproducibly, and at scale.
🧩 TL;DR
Running A/B tests at scale is about discipline, not just data.
- Start with the decision, not the hypothesis. Define what choice the experiment will inform and what metrics you expect to move before it starts. Otherwise, you risk matching a narrative to random noise.
- Power your tests properly. Ensure you can detect meaningful effects at the right confidence level. Underpowered experiments waste time and mislead decisions.
- Segment intelligently. Break results down by demographics, platform, and engagement levels to uncover where an idea works and where it doesn’t, but balance insight with complexity.
- Use a metric framework. Combine product metrics (feature success), ecosystem metrics (platform impact), and guardrail metrics (long-term health) to interpret results responsibly.
- Leverage backtests and holdouts. Move fast while keeping rigor by tracking long-term effects post-launch and measuring incremental impact of bundled systems.
The best experimentation cultures move fast because they measure deeply, not in spite of it.
1. Start With the Decision, Not Just the Hypothesis
A good A/B test begins long before code is written. The key question is:
What decision will this experiment inform, and what would we do differently depending on the outcome?
That question drives clarity around what success actually means — are you deciding to launch, iterate, or sunset a product? Are you validating user value or technical performance?
Before starting, teams should also:
- Define the metrics you expect to move (and in what direction).
- Document the expected relationships between metrics.
- List guardrails that must not regress.
Why this matters:
- With hundreds of metrics, some will appear significant by chance.
- Having a clear hypothesis and decision table prevents narrative-matching after results are known.
- It ensures that you don’t over-index on a false positive just to justify a launch.
2. Power Analysis: Detecting What Actually Matters
Many experiments fail not because the idea is bad, but because the test was underpowered.
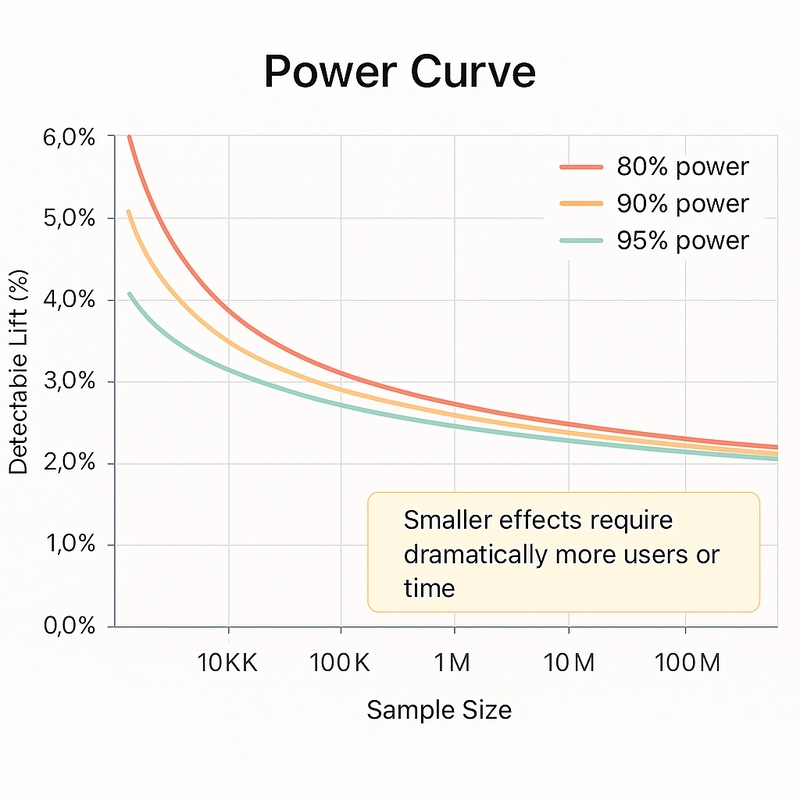
Power analysis ensures your experiment has enough sample size and duration to detect the desired effect size at a chosen confidence level.
Key points:
- Aim for around 90% power and 95% confidence.
- Small effects on massive populations can require long tests.
- Trade-off: Sensitivity vs. speed. A smaller detectable lift means slower decision-making.
Example: detecting a 1% lift in retention on 100 million users might take weeks, while a 10% lift on a smaller segment could be measurable in days.

3. Segmentation: Finding the Story Behind the Average
The average treatment effect rarely tells the full story. Segmentation helps uncover where an idea works — and where it doesn’t.
Common breakdowns include:
- Demographics: age, region, country groupings
- Platform: iOS vs. Android
- User state: new vs. returning users
- Engagement buckets: low, medium, high
Segmentation reveals patterns such as:
- A feature that helps younger users in the U.S. but hurts older users in emerging markets.
- A change that works on Android but not iOS due to implementation differences.
These insights help refine rollout strategy. But they also create tradeoffs:
- Launching only to positive cohorts can fragment the product and create tech debt.
- Uniform global launches may sacrifice local optimization for simplicity.
Finding that balance is key to experimentation at scale.

4. The Metric Framework: Product, Ecosystem, Guardrails
Every great experiment uses a layered metric framework that separates local success from system-level health.
1. Product Metrics
These are the feature’s direct performance indicators.
- Usually deeper-funnel, leading indicators
- Example: transactions per active buyer, listing click-through rate, or messages sent
2. Ecosystem Metrics
These measure the feature’s impact on the broader product.
- Example: a Marketplace improvement might drive transactions but reduce time spent in Video or Groups
- Key metrics: DAU, total timespent, session count, engagement across surfaces
3. Guardrail Metrics
High-signal indicators of user experience and long-term health.
- Example: notification volume might increase DAU short term, but rising mute or disable rates can signal long-term harm
- Early warning metrics that prevent unintended damage
Together, these three layers:
- Keep teams from optimizing for vanity lifts
- Clarify tradeoffs between short-term and long-term goals
- Enable product velocity without losing systemic awareness

5. Holdouts and Backtests: Measuring What Launches Miss
Most product teams want to move fast and ship improvements early. But speed and confidence can coexist when you plan for it.
Two key tools make this possible:
Backtests
- Launch to about 95% of users.
- Keep 5% as a control group.
- Track the long-term outcomes of launched changes.
- Especially useful for features that impact the engagement flywheel or connection model, where effects take weeks or months to mature.
Holdouts
- Used when multiple interacting features make isolated testing difficult (for example, notifications, ranking, or recommendations).
- Hold out the entire bundle to measure combined incrementality.
- Helps answer “What’s the overall effect of this system?”
Cautions when using holdouts:
- Don’t create artificially broken experiences.
- Example: if users expect real-time notifications when someone comments, removing that entirely can break their mental model.
- Continuously monitor user reports and feedback during holdouts to ensure measurement remains accurate and user trust intact.
6. Closing Thoughts
Running A/B tests at scale is not just about statistical rigor. It is about creating a repeatable learning system.
The most effective organizations:
- Know why they are testing
- Define how success will be measured
- Build guardrails to protect user experience
- Establish backtests and long-term tracking to ensure launches deliver durable value
This framework allows companies like Meta to iterate and launch quickly without compromising data quality or user trust.
The fastest teams are often the most measured ones, not because they skip validation, but because they have made it part of their culture.