I Tested GPU Time-Slicing With Real LLMs So You Don’t Have To 🚀
🎯 TL;DR – The Numbers Don’t Lie
I spent a week testing NVIDIA time-slicing on AWS EKS with real LLM workloads (not toy examples). Here’s what actually happens:
- ✅ Time-slicing overhead: Only ~1% (NVIDIA crushed this)
- ❌ Concurrent workloads: 50-100% performance degradation (physics can’t be cheated)
- 💰 Cost savings: 50% reduction for sequential workloads
- 🎯 Best use: Dev/test environments, time-shifted workloads
Bottom line: Time-slicing is brilliant for isolation, terrible for concurrent performance.
📦 Full code, configs, and test scripts: GitHub Repository
🔑 Quick Reference – Key Terms
Before we dive deep, here’s your decoder ring:
| Term | What It Means | Why You Care |
|---|---|---|
| Time-Slicing | GPU virtualization creating multiple virtual GPUs from one physical GPU | Lets multiple apps share a GPU |
| OOM | Out Of Memory – when GPU runs out of VRAM | Your pods crash mysteriously |
| TGI | Text Generation Inference – HuggingFace’s LLM serving engine | Industry standard for serving models |
| Concurrent | Multiple workloads running simultaneously | Where performance degradation happens |
| Sequential | Workloads running one after another | Where time-slicing shines |
💸 The $500 Question That Started This
Picture this: You’re running two LLM models in production. That’s $2/hour for two GPU instances. Over a month, that’s $1,440. Your CFO is asking why the GPU bill is so high.
Then someone mentions NVIDIA time-slicing: “Just share one GPU between both models!”
The question everyone asks: Does this actually work without destroying performance?
The answer everyone gives: “It depends…” (not helpful)
So I decided to test it with real production workloads and actual performance measurement. No toy examples. No theoretical benchmarks. Just two real LLMs hammering a shared GPU.
Spoiler: The results surprised me.
🏗️ The Test Lab Setup
Here’s what I built for this experiment:
🎮 The Hardware
- GPU: NVIDIA L40S (46GB VRAM) – The new hotness
- Instance: g6e.2xlarge (~$1.01/hour in us-west-2)
- Cost: Much cheaper than p3.8xlarge ($12.24/hour)
- Kubernetes: EKS 1.32 with NVIDIA GPU Operator
🤖 The Contenders
Model A: Microsoft Phi-3.5-mini-instruct
- Size: ~4GB memory footprint
- Speed: Fast inference (< 1 second)
- Use case: Quick responses, high throughput
Model B: DeepSeek-R1-Distill-Llama-8B
- Size: ~8GB memory footprint
- Speed: Slower but more thoughtful (~1 second)
- Use case: Complex reasoning, detailed outputs
Both running: HuggingFace Text Generation Inference (TGI) 3.3.4
💡 Why these models? They represent real production workloads – different sizes, different performance profiles, and combined they use ~12GB (26% of available 46GB).
🔥 The 3 Mistakes I Made (So You Don’t Have To)
Mistake #1: “GPUs Just Work™” (They Don’t)
What I expected: Spin up g6e.2xlarge, GPU drivers already installed (like p3 instances)
What actually happened: No GPU detected. Pods stuck in Pending. Panic.
kubectl describe pod
# Events: 0/1 nodes available: insufficient nvidia.com/gpu
The plot twist: Unlike p3 instances, g6e.2xlarge doesn’t come with pre-installed NVIDIA drivers in EKS managed node groups.
The fix that saved the day:
# NVIDIA GPU Operator does ALL the heavy lifting
helm install gpu-operator nvidia/gpu-operator \
  --namespace gpu-operator \
  --create-namespace \
  --set nodeSelector.eks-node=gpu \
  --wait
This magical operator automatically:
- ✅ Installs NVIDIA drivers
- ✅ Configures container toolkit
- ✅ Deploys device plugin
- ✅ Sets up GPU feature discovery
💡 Pro tip: Always use GPU Operator for modern EKS setups. Manual driver installation is pain.
Mistake #2: “Just Deploy Both Models” (OOM Speedrun)
What I tried: Deploy both models with default settings
What happened: Both pods started… then crashed with cryptic errors
RuntimeError: CUDA out of memory. Tried to allocate 20.00 GiB
The problem: Each model tried to grab ~80% of GPU memory. Math doesn’t work:
- Model A: 80% × 46GB = 36.8GB
- Model B: 80% × 46GB = 36.8GB
- Total needed: 73.6GB
- Available: 46GB ❌
The fix: Aggressive memory limits per model
args:
  - "--cuda-memory-fraction"
  - "0.4"  # 🎯 Only use 40% GPU memory per model
  - "--max-batch-prefill-tokens"
  - "4096"  # ⚠️ Reduced from default 8192
  - "--max-input-length"
  - "256"  # 🔒 Limit input size
  - "--max-total-tokens"
  - "512"  # 🔒 Limit output size
The math that works:
- Model A: 40% × 46GB = 18.4GB ✅
- Model B: 40% × 46GB = 18.4GB ✅
- Total: 36.8GB (80% utilization) ✅
- System overhead: 20% buffer ✅
🚨 Critical setting: Without
cuda-memory-fraction, models will OOM during warmup. This isn’t optional!
Mistake #3: “Time-Slicing Config Is Obvious” (It’s Not)
What the docs say: Create a ConfigMap
What they don’t say: You need TWO ConfigMaps and an operator upgrade
The complete configuration:
# ConfigMap 1: Time-slicing configuration
apiVersion: v1
kind: ConfigMap
metadata:
name: time-slicing-config
namespace: gpu-operator
data:
any: |-
version: v1
sharing:
timeSlicing:
resources:
- name: nvidia.com/gpu
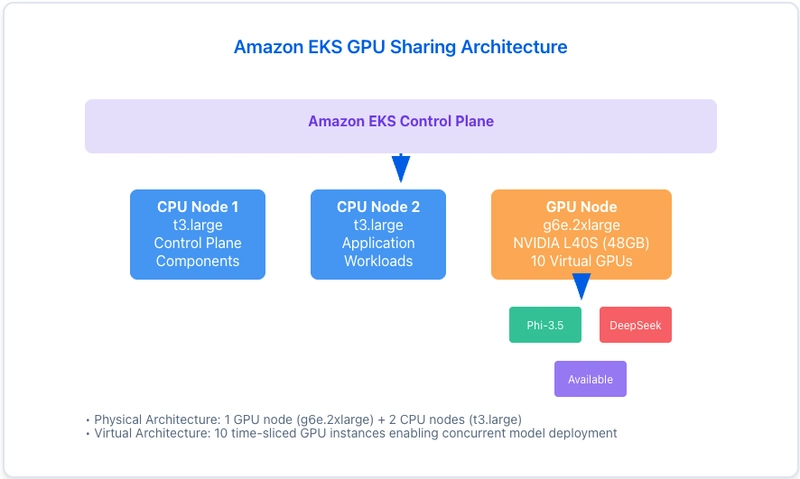
replicas: 10 # 🎯 10 virtual GPUs from 1 physical
---
# ConfigMap 2: Device plugin config
apiVersion: v1
kind: ConfigMap
metadata:
name: device-plugin-config
namespace: gpu-operator
data:
any: |-
version: v1
flags:
migStrategy: none
sharing:
timeSlicing:
renameByDefault: false
failRequestsGreaterThanOne: false
resources:
- name: nvidia.com/gpu
replicas: 10
Then upgrade the operator:
helm upgrade gpu-operator nvidia/gpu-operator \
  --namespace gpu-operator \
  --set devicePlugin.config.name=device-plugin-config \
  --wait
Verify it worked:
kubectl describe node  | grep nvidia.com/gpu

# Before:  nvidia.com/gpu: 1  ❌
# After:   nvidia.com/gpu: 10 ✅
🎉 Success: Your cluster now advertises 10 virtual GPUs instead of 1!
What this means: You can now schedule 10 pods requesting nvidia.com/gpu: 1 on a single physical GPU.
📊 The Results (Prepare to Be Surprised)
Test Scenario 1: Individual Performance (No Competition)
First, I tested each model alone with time-slicing enabled. Would time-slicing itself add overhead?
Phi-3.5-Mini Flying Solo
| Configuration | Avg Latency | Throughput | Success Rate |
|---|---|---|---|
| Time-sliced GPU | 0.609s | 98.44 req/min | 100% ✅ |
| Exclusive GPU | 0.603s | 99.46 req/min | 100% ✅ |
| Overhead | +0.006s | -1.02 req/min | 0% |
Overhead: ~1% 🎉
DeepSeek-R1 Flying Solo
| Configuration | Avg Latency | Throughput | Success Rate |
|---|---|---|---|
| Time-sliced GPU | 1.135s | 52.84 req/min | 100% ✅ |
| Exclusive GPU | 1.142s | 52.49 req/min | 100% ✅ |
| Overhead | -0.007s | +0.35 req/min | 0% |
Overhead: ~1% (actually slightly faster!) 🤯
💡 Key Insight #1: NVIDIA time-slicing overhead is negligible. The virtualization layer is incredibly efficient. This is exceptional engineering.
Test Scenario 2: Concurrent Performance (The Real Test)
Now both models hitting the GPU simultaneously. Every request from both models at the same time.
This is where reality hits.
Phi-3.5-Mini Under Fire
| Metric | Baseline | Concurrent | Impact |
|---|---|---|---|
| Latency | 0.609s | 1.227s | 🔴 +101.4% |
| Throughput | 98.44 req/min | 48.89 req/min | 🔴 -50.3% |
| Success Rate | 100% | 100% | ✅ Still stable |
DeepSeek-R1 Under Fire
| Metric | Baseline | Concurrent | Impact |
|---|---|---|---|
| Latency | 1.135s | 1.778s | 🔴 +56.6% |
| Throughput | 52.84 req/min | 33.74 req/min | 🔴 -36.1% |
| Success Rate | 100% | 100% | ✅ Still stable |
🚨 Key Insight #2: Resource competition is BRUTAL. When both models compete for the same GPU, performance tanks by 50-100%.
📈 Visual Performance Comparison
Individual Performance (Time-Slicing Overhead)
━━━━━━━━━━━━━━━━━━━━━━━━━━━━━━━━━━━━━━━━━━━
Exclusive GPU:    ████████████████████ 100%
Time-Sliced GPU:  ███████████████████░ 99%
                  ↑ Only 1% difference!

Concurrent Performance (Resource Competition)
━━━━━━━━━━━━━━━━━━━━━━━━━━━━━━━━━━━━━━━━━━━
Baseline:         ████████████████████ 100%
Concurrent:       ██████████░░░░░░░░░░ 50%
                  ↑ Ouch. Physics can't be cheated.
🤔 Why This Happens (The Physics)
Time-slicing overhead (~1%):
- ✅ Context switching is fast
- ✅ Memory isolation is efficient
- ✅ Scheduling overhead is minimal
Resource competition (50-100% degradation):
- ❌ Both models fight for GPU cores
- ❌ Memory bandwidth saturation
- ❌ L2 cache thrashing
- ❌ Shared memory contention
The verdict: Time-slicing technology is brilliant. GPU resource sharing is expensive.
🎯 The Decision Framework (Should YOU Use Time-Slicing?)
✅ Perfect Use Cases – Deploy With Confidence
1. Development & Testing Environments 🧪
Scenario: QA team needs to test 3 model versions
Cost without time-slicing: $3/hour (3 GPUs)
Cost with time-slicing: $1/hour (1 GPU)
Savings: $1,440/month
Performance impact: None (sequential testing)
Verdict: Slam dunk ✅
2. Time-Shifted Workloads ⏰
Scenario: Model A (business hours), Model B (batch processing at night)
Overlap: < 10% of time
Performance: 99% (negligible overhead when not competing)
Savings: 50% GPU costs
Verdict: Perfect fit ✅
3. Demo & POC Deployments 🎬
Scenario: Sales demo with multiple model comparisons
Requirements: Not production, occasional use
Budget: Limited
Performance needs: "Good enough"
Verdict: Ideal use case ✅
4. CI/CD Model Testing 🔄
Scenario: Automated model validation pipelines
Pattern: Sequential test runs
Peak load: One test at a time
Cost optimization: Critical
Verdict: Great match ✅
❌ Terrible Use Cases – Avoid These
1. Production Inference Serving 💼
Scenario: Customer-facing API with SLA requirements
Requirement: < 100ms response time
Concurrent load: Unpredictable spikes
Impact: 50-100% degradation = SLA violations
Verdict: Don't even think about it ❌
2. High-Throughput Concurrent Workloads 🚀
Scenario: Multiple models serving real-time traffic
Load pattern: Constant concurrent requests
Performance impact: Immediate 50% throughput loss
Business impact: Lost revenue, poor UX
Verdict: Hard pass ❌
3. Latency-Sensitive Applications ⚡
Scenario: Real-time chat, autocomplete, voice assistants
SLA: Sub-second responses required
Concurrent degradation: Doubles latency
User impact: Frustrated users, high churn
Verdict: Nope ❌
4. Auto-Scaling Production Workloads 📈
Scenario: Traffic scales unpredictably
Problem: Can't predict when models compete
Risk: Performance collapse during peak times
Business impact: Revenue loss during high-traffic
Verdict: Too risky ❌
🤔 Decision Tree – Find Your Path
Start Here
    │
    ├─ Is this production? ─── YES ──→ Will workloads overlap?
    │                                       │
    │                                       ├─ YES ──→ ❌ Don't use time-slicing
    │                                       │
    │                                       └─ NO ───→ ✅ Consider time-slicing
    │
    └─ NO (Dev/Test) ─────────────────────→ ✅ Use time-slicing
                                                 (perfect use case!)
💰 ROI Calculator – Your Break-Even Analysis
| Scenario | Without Time-Slicing | With Time-Slicing | Monthly Savings |
|---|---|---|---|
| 2 Models, Sequential | $1,440 | $720 | $720 ✅ |
| 2 Models, 30% Overlap | $1,440 | $720 | $720 (but some degradation) ⚠️ |
| 2 Models, 50% Overlap | $1,440 | $720 | $720 (significant degradation) ❌ |
| 2 Models, Always Concurrent | $1,440 | $720 | Not worth it ❌ |
Break-even point: If your workloads overlap < 30% of the time, time-slicing typically provides net positive value.
💡 Pro Tip: Monitor actual workload overlap in production before deciding. Use CloudWatch metrics to track GPU utilization patterns.
🧪 How I Tested This (Reproducible Science)
The Testing Strategy
I built an automated framework to eliminate human error and ensure reproducible results:
Test Protocol:
- ☝️ Test each model individually (establish baseline)
- ✌️ Test both models concurrently (measure degradation)
- 🔁 Repeat 3 times with 5 different prompts (45 requests total)
- 📊 Calculate statistical averages and impact percentages
The Automation Script
Here’s the core testing logic (simplified):
#!/bin/bash
# Complete performance testing framework

test_individual_model() {
    local endpoint=$1
    local model_name=$2

    # Test prompts covering different complexity levels
    local prompts=(
        "Explain machine learning"
        "What is Python programming"
        "Describe cloud computing"
        "How does AI work"
        "What are automation benefits"
    )

    # Run 3 iterations for statistical accuracy
    for iteration in $(seq 1 3); do
        for prompt in "${prompts[@]}"; do
            # Measure with millisecond precision
            start_time=$(date +%s.%N)

            response=$(curl -s -X POST "$endpoint/generate" \
                -H "Content-Type: application/json" \
                -d "{
                    \"inputs\": \"$prompt\",
                    \"parameters\": {
                        \"max_new_tokens\": 50,
                        \"temperature\": 0.7
                    }
                }")

            end_time=$(date +%s.%N)
            duration=$(echo "$end_time - $start_time" | bc)

            # Record results
            echo "$duration" >> "${model_name}_results.txt"
        done
    done

    # Calculate statistics
    calculate_stats "${model_name}_results.txt"
}

test_concurrent_models() {
    # Fire both requests simultaneously using background jobs
    for prompt in "${prompts[@]}"; do
        # Model A request
        {
            measure_latency "$PHI35_ENDPOINT" "$prompt" >> phi_concurrent.txt
        } &

        # Model B request
        {
            measure_latency "$DEEPSEEK_ENDPOINT" "$prompt" >> deepseek_concurrent.txt
        } &

        # Wait for both to complete
        wait
    done
}
Kubernetes Scaling for Test Control
The genius part: Using Kubernetes to control test scenarios:
# Test Phi-3.5 alone
kubectl scale deployment deepseek-r1-baseline --replicas=0 -n llm-testing
# Wait 30 seconds for graceful shutdown
./load_test.sh

# Test DeepSeek alone
kubectl scale deployment mistral-7b-baseline --replicas=0 -n llm-testing
kubectl scale deployment deepseek-r1-baseline --replicas=1 -n llm-testing
# Wait 30 seconds for startup
./load_test.sh

# Test both concurrently
kubectl scale deployment mistral-7b-baseline --replicas=1 -n llm-testing
# Wait 30 seconds for startup
./load_test.sh
💡 Why this works: Scaling deployments ensures clean test isolation without manual intervention or pod management.
What Made This Scientific
✅ Controlled environment: No other GPU workloads running
✅ Multiple iterations: 3 runs × 5 prompts = statistical validity
✅ Standardized prompts: Same inputs across all tests
✅ Consistent parameters: Same token limits, temperature
✅ Automated execution: Eliminates human timing errors
✅ Millisecond precision: Accurate latency measurement
Sample Output
=== Phi-3.5-Mini (Individual Baseline) ===
Total Requests: 15
Successful: 15 (100%)
Average Latency: 0.609s
Throughput: 98.44 req/min

=== Phi-3.5-Mini (Concurrent) ===
Average Latency: 1.227s (+101.4% 🔴)
Throughput: 48.89 req/min (-50.3% 🔴)

Report saved: test_results/GPU_SLICING_FULL_performance_report_20250725_095710.txt
📦 Get the complete testing framework: GitHub Repository
💰 The Money Talk – Real ROI Analysis
Let’s talk dollars and cents. Because at the end of the day, your CFO cares about the bottom line.
Scenario 1: Traditional Approach (Separate GPUs)
┌─────────────────────────────────┐
│  Model A: g6e.2xlarge           │
│  Cost: $1.01/hour               │
│  Performance: 100% ✅            │
└─────────────────────────────────┘

┌─────────────────────────────────┐
│  Model B: g6e.2xlarge           │
│  Cost: $1.01/hour               │
│  Performance: 100% ✅            │
└─────────────────────────────────┘

Total: $2.02/hour = $1,454/month
Scenario 2: Time-Slicing (Sequential Workloads)
┌─────────────────────────────────┐
│  Single g6e.2xlarge             │
│                                 │
│  Model A (9am-5pm)  ──────┐    │
│  Model B (6pm-8am)  ──────┤    │
│                                 │
│  Cost: $1.01/hour               │
│  Performance: 99% ✅             │
└─────────────────────────────────┘

Total: $1.01/hour = $727/month
Savings: $727/month (50% reduction! 🎉)
When this works: Workloads naturally time-shifted (batch processing, different timezones, dev/staging)
Scenario 3: Time-Slicing (Concurrent Workloads)
┌─────────────────────────────────┐
│  Single g6e.2xlarge             │
│                                 │
│  Model A + Model B (competing)  │
│                                 │
│  Cost: $1.01/hour               │
│  Performance: 50% ⚠️             │
└─────────────────────────────────┘

Total: $1.01/hour = $727/month
Savings: $727/month
Trade-off: 50% performance loss 💀
When this fails: Production inference, customer-facing APIs, latency-sensitive applications
The Financial Break-Even Matrix
| Workload Overlap | Cost Savings | Performance | Recommended? |
|---|---|---|---|
| 0-10% (mostly sequential) | 50% ✅ | 99% ✅ | Yes 🎯 |
| 10-30% (occasional overlap) | 50% ✅ | 80-90% ⚠️ | Maybe 🤔 |
| 30-50% (frequent overlap) | 50% ✅ | 60-80% ⚠️ | Risky 😬 |
| 50%+ (mostly concurrent) | 50% ❌ | 50% ❌ | No 🚫 |
Real-World Cost Example (My Consulting Client)
Their Setup:
- Dev environment: 2 models for A/B testing
- Usage pattern: Sequential (test Model A, then Model B)
- Previous cost: $1,440/month (2 GPUs)
After Time-Slicing:
- New cost: $720/month (1 GPU)
- Performance: 99% (negligible overhead)
- Savings: $8,640/year 💰
CFO’s reaction: “Why weren’t we doing this before?”
The Hidden Costs of Getting It Wrong
Mistake: Using time-slicing for production inference
Scenario: E-commerce chatbot with strict SLA (< 500ms response)
Before time-slicing:
Response time: 400ms ✅
Conversion rate: 12% ✅
Revenue impact: $0

After time-slicing (concurrent load):
Response time: 800ms ❌ (SLA breach)
Conversion rate: 8% ❌ (users bounce)
Revenue impact: -$50,000/month 💀
Lesson: The $720/month GPU savings cost them $50,000/month in revenue. Not worth it.
Your ROI Decision Tree
Question 1: Are your workloads production-facing?
    │
    ├─ NO ──→ Question 2: Do workloads overlap?
    │           │
    │           ├─ NO ──→ ✅ Use time-slicing (50% savings!)
    │           │
    │           └─ YES ──→ ⚠️ Prototype and measure first
    │
    └─ YES ──→ Question 3: Can you tolerate 50% performance loss?
                │
                ├─ NO ──→ ❌ Don't use time-slicing
                │
                └─ YES ──→ 🤔 Are you SURE? Measure twice, deploy once.
💡 Pro Tip: Always prototype with time-slicing in staging before production. Measure actual performance impact with YOUR workloads, not theoretical benchmarks.
🚀 Quick Start – Get Running in 30 Minutes
Want to try this yourself? Here’s the exact path I followed.
Prerequisites Check ✅
# Verify you have these tools installed
kubectl version --client
helm version
eksctl version
aws --version

# If any are missing, install from:
# kubectl: https://kubernetes.io/docs/tasks/tools/
# helm: https://helm.sh/docs/intro/install/
# eksctl: https://eksctl.io/installation/
# aws: https://aws.amazon.com/cli/
Step 1: Create EKS Cluster (15 minutes)
# Create cluster configuration file
cat << 'EOF' > cluster-config.yaml
apiVersion: eksctl.io/v1alpha5
kind: ClusterConfig
metadata:
  name: gpusharing-demo
  region: us-west-2
  version: "1.32"
nodeGroups:
  - name: main
    instanceType: t3.large
    desiredCapacity: 2
    minSize: 2
    maxSize: 4
  - name: gpu
    instanceType: g6e.2xlarge
    desiredCapacity: 1
    minSize: 1
    maxSize: 1
    labels:
      eks-node: gpu
EOF

# Create the cluster (takes ~15 minutes)
eksctl create cluster -f cluster-config.yaml

# Verify nodes are ready
kubectl get nodes
What you’ll see:
NAME                         STATUS   ROLE    AGE
ip-192-168-1-1...            Ready      5m    # t3.large
ip-192-168-1-2...            Ready      5m    # t3.large
ip-192-168-1-3...            Ready      5m    # g6e.2xlarge (GPU!)
Step 2: Install NVIDIA GPU Operator (5 minutes)
# Add NVIDIA Helm repository
helm repo add nvidia https://helm.ngc.nvidia.com/nvidia
helm repo update

# Install GPU Operator (this does ALL the heavy lifting)
helm install gpu-operator nvidia/gpu-operator \
  --namespace gpu-operator \
  --create-namespace \
  --set nodeSelector.eks-node=gpu \
  --wait

# Verify installation (all pods should be Running)
kubectl get pods -n gpu-operator
Wait for all pods to show 1/1 Running (takes 2-3 minutes)
Step 3: Enable Time-Slicing (3 minutes)
# Download complete configuration
wget https://raw.githubusercontent.com/AbrahamArellano/eks-shared-gpu-ai-performance/main/infra/time-slicing-config.yaml

# Apply time-slicing configuration
kubectl apply -f time-slicing-config.yaml

# Upgrade GPU operator with time-slicing
helm upgrade gpu-operator nvidia/gpu-operator \
  --namespace gpu-operator \
  --set devicePlugin.config.name=device-plugin-config \
  --wait
Verify it worked:
kubectl describe node $(kubectl get nodes -l eks-node=gpu -o jsonpath='{.items[0].metadata.name}') | grep "nvidia.com/gpu:"

# Expected output:
#  nvidia.com/gpu:     10  ✅ (not 1!)
Step 4: Deploy Your Models (5 minutes)
# Create namespace
kubectl create namespace llm-testing

# Clone the complete repository
git clone https://github.com/AbrahamArellano/eks-shared-gpu-ai-performance.git
cd eks-shared-gpu-ai-performance

# Deploy both models with memory-optimized configs
kubectl apply -f models/mistral-memory-optimized.yaml
kubectl apply -f models/deepseek-memory-optimized.yaml

# Watch pods start (takes 2-3 minutes to download models)
kubectl get pods -n llm-testing -w
Wait for both pods to show 1/1 Running
Step 5: Run Performance Tests (2 minutes)
# Port forward to access models locally
kubectl port-forward svc/mistral-7b-service 8081:8080 -n llm-testing &
kubectl port-forward svc/deepseek-r1-service 8082:8080 -n llm-testing &

# Run the complete test suite
cd tests
chmod +x load_test.sh
./load_test.sh
Output you’ll see:
=== Complete GPU Time-Slicing Performance Analysis ===
Testing Phi-3.5-Mini (Individual Baseline)...
  ✓ Test 1: 0.610s
  ✓ Test 2: 0.602s
  ...

Testing DeepSeek-R1 (Individual Baseline)...
  ✓ Test 1: 1.142s
  ...

Testing Both Models Concurrently...
  ✓ Both completed
  ...

Report saved: test_results/performance_report_YYYYMMDD_HHMMSS.txt
Step 6: View Your Results
# View the latest report
cat tests/test_results/performance_report_*.txt | tail -30
You’ll see something like this:
=== Phi-3.5-Mini Individual Baseline ===
Average Latency: 0.609s
Throughput: 98.44 req/min

=== Phi-3.5-Mini Concurrent Performance ===
Average Latency: 1.227s
Performance Impact: +101.4% latency 🔴
🎉 Success! You’ve Now:
✅ Created an EKS cluster with GPU support
✅ Enabled NVIDIA time-slicing (10 virtual GPUs)
✅ Deployed two real LLM models
✅ Measured actual performance impact
✅ Generated comprehensive performance reports
Cleanup (Don’t Forget!)
# Delete the entire cluster to avoid charges
eksctl delete cluster gpusharing-demo --region us-west-2

# Verify deletion
aws eks list-clusters --region us-west-2
⚠️ Important: Running this setup costs ~$1.20/hour. Don’t forget to delete when done!
Troubleshooting Common Issues
Problem: Pods stuck in Pending
# Check if GPU is detected
kubectl describe node  | grep nvidia.com/gpu

# If shows 0, restart device plugin
kubectl rollout restart daemonset/nvidia-device-plugin-daemonset -n gpu-operator
Problem: Models crash with OOM
# Check cuda-memory-fraction in deployment
kubectl describe deployment mistral-7b-baseline -n llm-testing

# Should see: --cuda-memory-fraction 0.4
# If not, update the YAML and reapply
Problem: Can’t access models via port-forward
# Check if services exist
kubectl get svc -n llm-testing

# Check if pods are ready
kubectl get pods -n llm-testing

# Restart port-forward
pkill -f port-forward
kubectl port-forward svc/mistral-7b-service 8081:8080 -n llm-testing &
📚 Next Steps
- Experiment: Try different models from HuggingFace
- Optimize: Tune memory fractions for your workloads
- Monitor: Set up CloudWatch for GPU metrics
- Scale: Add more GPU nodes if needed
Complete implementation guide: GitHub Repository
💡 5 Things I Wish I Knew Before Starting
1. “Pre-installed Drivers” Doesn’t Mean What You Think
What I assumed: g6e instances come with NVIDIA drivers like p3 instances
Reality check: Spent 2 hours debugging why pods couldn’t see the GPU
The lesson: Always use GPU Operator for modern EKS setups. It’s not optional—it’s essential.
Time saved for you: 2 hours of confusion 😅
2. Memory Limits Are Not Suggestions
What I did first: Deployed models with default settings
What happened: Both models tried to grab 80% of GPU memory each
The crash: CUDA out of memory errors everywhere
The fix: cuda-memory-fraction: 0.4 is your best friend
Lesson: In GPU sharing, aggressive memory limits aren’t pessimistic—they’re realistic.
3. Time-Slicing ≠ Magic Performance Multiplier
Marketing says: “Share one GPU across multiple workloads!”
Reality says: “Share one GPU across multiple workloads… but not at full speed concurrently”
The truth: Time-slicing provides isolation, not performance multiplication.
Mental model: Think of it like time-sharing a CPU, not adding more cores.
4. Test Sequential Before Assuming Concurrent
My mistake: Assumed concurrent workloads would work “well enough”
The numbers: 50-100% performance degradation
The learning: Always measure YOUR workloads with YOUR patterns
Pro tip: Use Kubernetes scaling to isolate test scenarios cleanly
5. Production ≠ Development (Obvious, But…)
Development: Time-slicing is perfect
- Cost savings? Yes ✅
- Performance trade-offs? Acceptable ✅
- Stability? Excellent ✅
Production: Time-slicing is risky
- SLA requirements? Violated ❌
- Unpredictable performance? Dangerous ❌
- Customer experience? Compromised ❌
The rule: If it touches paying customers, provision separate GPUs.
🎬 The Verdict – Should You Use Time-Slicing?
After a week of testing, thousands of inference requests, and countless hours of analysis, here’s my honest take:
✅ Time-Slicing Is Brilliant For:
- Development environments where cost matters more than peak performance
- Sequential workloads with natural time-shifting patterns
- A/B testing where models don’t compete simultaneously
- POC/Demo environments with flexible requirements
- Learning and experimentation without breaking the bank
ROI: 50% cost savings with 99% performance ✅
❌ Time-Slicing Is Terrible For:
- Production inference serving customer traffic
- Concurrent workloads with strict SLA requirements
- Latency-sensitive applications where milliseconds matter
- Revenue-generating systems where performance = money
- Auto-scaling workloads with unpredictable patterns
Risk: 50-100% performance degradation = unhappy customers ❌
The Technology Itself? 🏆 A+ Engineering
NVIDIA absolutely crushed the implementation:
- Only ~1% overhead from time-slicing mechanism
- Rock-solid stability (zero crashes in extensive testing)
- Clean Kubernetes integration
- Production-grade reliability
The performance degradation comes from physics, not technology.
You can’t cheat the fundamental limitations of shared resources. Time-slicing doesn’t create more GPU compute—it manages access to existing compute.
🚀 Your Next Steps
If You’re Convinced (Dev/Test Use Case):
- ⭐ Star the repo: GitHub Repository
- 🔧 Follow the Quick Start: 30 minutes to working setup
- 📊 Run your own tests: Measure YOUR workloads
- 💰 Calculate YOUR ROI: Use the decision framework
- 🎉 Deploy and save money: Start with dev environments
If You’re Skeptical (Production Use Case):
- ✅ Provision separate GPUs: Safety first
- 🧪 Test time-slicing in staging: Validate with real traffic patterns
- 📈 Monitor overlap patterns: Measure actual concurrent load
- 🤔 Reconsider for off-peak: Maybe time-slice during low-traffic hours?
If You’re Curious (Learning Mode):
- 📖 Read the full guide: Complete blog post
- 🎓 Understand the concepts: Time-slicing vs MIG vs MPS
- 🛠️ Experiment safely: Use the provided test framework
- 💬 Share your findings: Comment below with your results
📚 Complete Resource Library
Code & Configuration
- 📦 GitHub Repository: eks-shared-gpu-ai-performance
- Complete Kubernetes manifests
- Automated testing framework
- Performance analysis scripts
- Troubleshooting guides
Deep Dive Content
- 📝 Full Technical Analysis: MyITBasics.com
- 🏗️ Architecture Patterns: Complete infrastructure setup guide
- 🔍 Performance Analysis: Detailed metrics and methodology
- 💡 Best Practices: Production-ready recommendations
💬 Let’s Discuss – Your Turn!
I’ve shared my findings. Now I want to hear yours:
💭 Questions for the community:
- Have you used GPU time-slicing in production? What was your experience?
- What workload patterns are you trying to optimize?
- Any other GPU sharing strategies you’ve found effective?
- Found bugs or improvements in my testing methodology?
🐛 Found an issue in the code?
Open an issue or PR on GitHub
💡 Want to discuss your specific use case?
Drop a comment below—I read and respond to all of them!
📧 Need consulting help?
Visit MyITBasics.com for architecture guidance
🙏 Thanks for Reading!
If you found this helpful:
- ⭐ Star the GitHub repo to bookmark for later
- 💬 Comment below with your experiences or questions
- 🔄 Share this post with your team
- 👤 Follow me for more deep-dives into GPU architecture, AI infrastructure, and cloud-native engineering
Coming up next: Multi-GPU strategies, MIG vs time-slicing comparison, and cost optimization techniques for production AI workloads.
Stay tuned! 🚀
Built with curiosity, tested with rigor, shared with the community.
— Abraham Arellano
Cloud Architect & AI Infrastructure Engineer
MyITBasics.com | GitHub