Even in the age of cloud-native apps and distributed tracing, plain old log files remain one of the richest sources of truth in any system. From legacy business applications and batch jobs to NGINX, databases, and on-prem infrastructure, critical diagnostics still end up written to disk.
The OpenTelemetry Collector filelog receiver gives you a way to bring those logs into a modern observability pipeline. It continuously tails files, parses their contents, and converts raw text into structured OpenTelemetry LogRecords.
This guide shows you how to put that power to work, from the basics of reading a file to building a production-ready pipeline that handles rotation, recovers from restarts, and never loses a single line. You’ll learn how to structure, enrich, and standardize log file entries so they become first-class observability data.
Let’s begin!
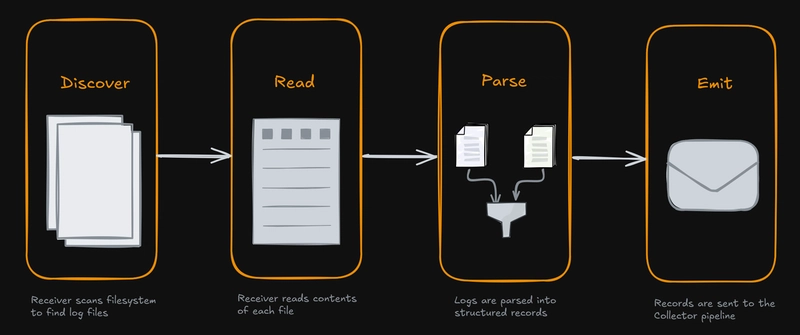
How the Filelog receiver works

Before we get into configuration details, it helps to picture how the receiver handles a log file throughout its lifecycle. You can think of it as a simple repeating four-step loop:
-
Discover: The receiver scans the filesystem at regular intervals, using the
includeandexcludepatterns you’ve set, to figure out which log files it should pay attention to. -
Read: Once a file is picked up, the receiver opens it and begins following along as new lines are written. The
start_atsetting decides whether it begins frombeginningor just tails new content from theend. -
Parse: Each line (or block of lines, if multiline parsing is used) runs through a series of Stanza operators (if configured). These operators parse the raw text, pull out key attributes, assign timestamps and severity levels, and ultimately structure the log data.
-
Emit: Finally, the structured log records are passed into the Collector’s pipeline, where they can be filtered, transformed further, or exported to your backend.
This Discover -> Read -> Parse -> Emit loop forms the foundation of everything the receiver does.
Quick Start: tailing a log file
One of the most common use cases is when your application is already writing logs in JSON format to a file. For example, imagine you have a service writing JSON logs to /var/log/myapp/app.log:
{"time":"2025-09-28 20:15:12","level":"INFO","message":"User logged in successfully","user_id":"u-123","source_ip":"192.168.1.100"}
{"time":"2025-09-28 20:15:45","level":"WARN","message":"Password nearing expiration","user_id":"u-123"}
Here’s a minimal filelog receiver example to read and ingest such logs into an OpenTelemetry pipeline:
# otelcol.yaml
receivers:
  filelog:
    # 1. DISCOVER all .log files in /var/log/myapp/
    include: [/var/log/myapp/*.log]
    # 2. READ from the beginning of new files
    start_at: beginning
    # 3. PARSE using the json_parser operator
    operators:
      - type: json_parser
        # Tell the parser where to find the timestamp and how it's formatted
        timestamp:
          parse_from: attributes.time
          layout: "%Y-%m-%d %H:%M:%S"
        # Tell the parser which field contains the severity
        severity:
          parse_from: attributes.level

exporters:
  debug:
    verbosity: detailed

service:
  pipelines:
    logs:
      receivers: [filelog]
      exporters: [debug]
Here’s a breakdown of the above configuration:
-
include: Points the receiver to all.logfiles in/var/log/myapp/. -
start_at: beginning: Ensures the receiver processes the entire file the first time it sees it. By default (end), it would only capture new lines written after the Collector starts. -
operators: In this case, there’s just one: the json_parser. Its job is to take each log line, interpret it as JSON, and then promote selected fields into the log record’s core metadata. -
timestampandseverity: Within thejson_parser, we’re pulling thetimeandlevelfields out of the JSON and promoting them to the OpenTelemetry’s top-levelTimestampandSeverity*fields for each log record.
With the debug exporter, you’ll see the parsed and structured output. Instead of just raw JSON, each field is now properly represented inside each log record:
LogRecord #0
ObservedTimestamp: 2025-09-28 20:48:36.728437503 +0000 UTC
Timestamp: 2025-09-28 20:15:12 +0000 UTC
SeverityText: INFO
SeverityNumber: Info(9)
Body: Str({"time":"2025-09-28 20:15:12","level":"INFO","message":"User logged in successfully","user_id":"u-123","source_ip":"192.168.1.100"})
Attributes:
     -> user_id: Str(u-123)
     -> source_ip: Str(192.168.1.100)
     -> log.file.name: Str(myapp.log)
     -> time: Str(2025-09-28 20:15:12)
     -> level: Str(INFO)
     -> message: Str(User logged in successfully)
Trace ID:
Span ID:
Flags: 0
The raw JSON logs have now been converted into OpenTelemetry’s unified log data format, ensuring a consistent foundation for cross-system observability.
The log.file.name attribute is automatically added by the receiver by default, and you can also enable include_file_path to capture the full file path as well:
# otelcol.yaml
receivers:
  filelog:
    include: [/var/log/myapp/*.log]
    include_file_path: true
This allows you to easily filter or query logs based on their exact source path:
Attributes:
     -> log.file.path: Str(/var/log/myapp/app.log)
     -> log.file.name: Str(app.log)
You can find more enrichment options in the official OpenTelemetry Filelog receiver documentation.
Filtering and managing log files
The most fundamental step in configuring the filelog receiver is telling it which files to monitor. This is controlled using include and exclude glob patterns.
The receiver first uses include to generate a list of all potential files, then it applies the exclude patterns to remove any unwanted files from that list.
Here’s an example:
# otelcol.yaml
receivers:
  filelog:
    include: [/var/log/apps/**/*.log]
    exclude:
      - /var/log/apps/**/debug.log
      - /var/log/apps/**/*.tmp
In this scenario, the receiver will collect every .log file under /var/log/apps/, including subdirectories, but it will skip any file named debug.log and any file ending with .tmp.
Excluding files by modification age
If the log directory you’re reading contains many existing log files, you can instruct the receiver to ignore files that have not been modified within a given time window with exclude_older_than:
# otelcol.yaml
receivers:
  filelog:
    include: [/var/log/myapp/*.log]
    exclude_older_than: 24h
    start_at: beginning
In this example, even if app-2025-07-15.log matches the pattern, it will be skipped if it hasn’t been updated in the past 24 hours.
Parsing unstructured text with regular expressions
Most infrastructure logs don’t come neatly packaged as JSON. More often, they’re plain text strings that follow a loose pattern, such as web server access logs, database query logs, or operating system messages. These logs are human-readable but difficult for machines to analyze until they’re given some structure.
The Collector addresses this with the regex_parser operator. Using regular expressions with named capture groups, you can break a raw log line into meaningful fields and promote them into structured attributes.
For example, consider an NGINX access log in the Common Log Format:
127.0.0.1 - - [28/Sep/2025:20:30:00 +0000] "GET /api/v1/users HTTP/1.1" 200 512
127.0.0.1 - - [28/Sep/2025:20:30:05 +0000] "POST /api/v1/login HTTP/1.1" 401 128
You can configure the regex_parser like this to parse them into structured attributes:
# otelcol.yaml
receivers:
  filelog:
    include: [/var/log/nginx/access.log]
    start_at: beginning
    operators:
      - type: regex_parser
        # Use named capture groups to extract data
        regex:
          '^(?P[^ ]+) - - \[(?P[^\]]+)\]
          "(?P[A-Z]+) (?P[^ "]+)[^"]*"
          (?P\d{3}) (?P\d+)$'
        # Parse the extracted timestamp
        timestamp:
          parse_from: attributes.timestamp
          layout: "%d/%b/%Y:%H:%M:%S %z"
        # Map status codes to severities
        severity:
          parse_from: attributes.status_code
          mapping:
            info:
              - min: 200
                max: 399
            warn: 4xx
            error: 5xx
The core of this setup is the regex expression with named capture groups. Each group labels a slice of the line so the parser can turn it into an attribute: client_ip grabs the remote address, timestamp captures the bracketed time string, http_method and http_path pull the request pieces, status_code picks up the three-digit response code, and response_size records the byte count.
Once those attributes exist, the timestamp field parses the timestamp string into a proper datetime value, and the severity block translates status codes into meaningful severity levels using an explicit mapping: 2xx and 3xx responses as INFO, 4xx as WARN, and 5xx as ERROR.
Once access logs are ingested with this configuration, you’ll see a structured log record with all the important pieces extracted out as attributes:
LogRecord #0
ObservedTimestamp: 2025-09-28 21:17:42.31729069 +0000 UTC
Timestamp: 2025-09-28 20:30:00 +0000 UTC
SeverityText: 200
SeverityNumber: Info(9)
Body: Str(127.0.0.1 - - [28/Sep/2025:20:30:00 +0000] "GET /api/v1/users HTTP/1.1" 200 512)
Attributes:
     -> status_code: Str(200)
     -> response_size: Str(512)
     -> log.file.name: Str(myapp.log)
     -> client_ip: Str(127.0.0.1)
     -> timestamp: Str(28/Sep/2025:20:30:00 +0000)
     -> http_method: Str(GET)
     -> http_path: Str(/api/v1/users)
Trace ID:
Span ID:
Flags: 0
With a single expression and a couple of parsing steps, a flat NGINX access log is transformed into structured OpenTelemetry data. A natural next step is aligning the captured attributes with the HTTP semantic conventions through the attributes processor or transform processor.
Handling multiple log formats
Log files rarely come in just one flavor. For example, you might be ingesting NGINX logs, database logs, and application logs, each with their own format.
The cleanest way to handle this is to define a separate filelog receiver for each file type. Each receiver has its own parsing rules and runs independently, which keeps your setup organized and easy to debug.
This is the best approach when the log formats are completely different and share nothing in common.
# otelcol.yaml
receivers:
  # NGINX access logs
  filelog/nginx_access:
    include: [/var/log/nginx/access.log]
    operators:
      - type: regex_parser
        # ... NGINX access log parsing rules

  # NGINX error logs
  filelog/nginx_error:
    include: [/var/log/nginx/error.log]
    operators:
      - type: regex_parser
        # ... NGINX error log parsing rules
Sometimes, though, variation happens within a single file.
Maybe most lines are simple messages, but others add extra fields like a trace_id:
INFO: Application started successfully.
DEBUG: Processing request for trace_id=12345
Instead of writing one massive regex to cover every case, you can use conditional operators with if:
# otelcol.yaml
receivers:
  filelog:
    include: [/var/log/app.log]
    operators:
      # Parse the basic structure of every line
      - type: regex_parser
        id: base_parser # a unique ID is required when multiple operators of the same type is being used
        regex: '^(?P\w+): (?P.*)$'

      # Only run this parser when "trace_id" appears
      - type: regex_parser
        id: trace_parser
        if: 'attributes["message"] matches "trace_id"'
        parse_from: attributes.message
        regex: '.*trace_id=(?P\w+).*'
Here’s what happens:
- The first parser runs on every log line and extracts
severityandmessage. - The second parser runs only when the message contains
trace_id, enriching the log with that extra field.
By combining these two approaches, multiple receivers for unrelated formats and conditional parsing for minor variations, you can handle almost any kind of log your systems produce without creating unreadable or brittle configurations.
Handling stack traces and multiline logs
Not all log entries fit neatly on a single line. A stack trace is a classic example:
2025-09-28 21:05:42 [ERROR] Unhandled exception: Cannot read property 'foo' of undefined
TypeError: Cannot read property 'foo' of undefined
    at Object. (/usr/src/app/index.js:15:18)
    at Module._compile (node:internal/modules/cjs/loader:1254:14)
    at Module._extensions..js (node:internal/modules/cjs/loader:1308:10)
    at Module.load (node:internal/modules/cjs/loader:1117:32)
    at Module._load (node:internal/modules/cjs/loader:958:12)
    at Function.executeUserEntryPoint [as runMain] (node:internal/modules/run_main:81:12)
    at node:internal/main/run_main_module:17:47
If you send this directly to the Collector, the filelog receiver will treat each line as a separate log record. That’s not what you want, since the error message and every stack frame belong together.
The fix is to use the multiline configuration, which tells the receiver how to group lines into a single entry:
# otelcol.yaml
receivers:
  filelog:
    include: [/var/log/myapp/*.log]
    start_at: beginning

    multiline:
      # New entry starts when a line begins with "YYYY-MM-DD HH:MM:SS"
      line_start_pattern: ^\d{4}-\d{2}-\d{2}\s+\d{2}:\d{2}:\d{2}

    operators:
      - type: regex_parser
        regex: (?P\d{4}-\d{2}-\d{2}\s+\d{2}:\d{2}:\d{2})\s+\[(?P[A-Za-z]+)\]\s+(?P.+)

        timestamp:
          parse_from: attributes.timestamp
          layout: "%Y-%m-%d %H:%M:%S"

        severity:
          parse_from: attributes.severity
Here, the line_start_pattern acts as the anchor. A new log entry begins only when a line starts with a date in the form YYYY-MM-DD HH:MM:SS, and any line that doesn’t match is appended to the previous one.
The result is that the entire stack trace, from the error message down through each at ... frame, gets captured as one structured log record. This preserves full context, making it far easier to analyze and troubleshoot errors.
LogRecord #0
ObservedTimestamp: 2025-10-07 12:04:26.963143642 +0000 UTC
Timestamp: 2025-09-28 21:05:42 +0000 UTC
SeverityText: ERROR
SeverityNumber: Error(17)
Body: Str(2025-09-28 21:05:42 [ERROR] Unhandled exception: Cannot read property 'foo' of undefined
TypeError: Cannot read property 'foo' of undefined
    at Object. (/usr/src/app/index.js:15:18)
    at Module._compile (node:internal/modules/cjs/loader:1254:14)
    at Module._extensions..js (node:internal/modules/cjs/loader:1308:10)
    at Module.load (node:internal/modules/cjs/loader:1117:32)
    at Module._load (node:internal/modules/cjs/loader:958:12)
    at Function.executeUserEntryPoint [as runMain] (node:internal/modules/run_main:81:12)
    at node:internal/main/run_main_module:17:47)
Attributes:
     -> log.file.name: Str(/var/log/myapp/app.log)
     -> message: Str(Unhandled exception: Cannot read property 'foo' of undefined)
     -> timestamp: Str(2025-09-28 21:05:42)
     -> severity: Str(ERROR)
Trace ID:
Span ID:
Flags: 0
Parsing metadata from file headers
Some log files don’t just contain log entries. They begin with a header section that holds important metadata about the entire file. Without that context, the individual log lines can be hard to interpret.
This pattern is common with batch jobs and export processes. For example, a nightly billing run might write a fresh log file for each execution. At the top of that file you might see something like this:
# Job-ID: job-d8e8fca2
# Job-Type: nightly-billing-run
# Executed-By: scheduler-prod-1
# Records-To-Process: 1500
2025-10-08T08:20:00Z INFO: Starting billing run.
2025-10-08T08:21:15Z INFO: Processed account #1.
2025-10-08T08:21:16Z WARN: Account #2 has a negative balance.
. . .
Those first lines tell you exactly which job produced the logs that follow. If you ignore them, you lose that crucial context. The header feature solves this by parsing metadata from the top of the file and stamping it onto every subsequent log record.
It defines a small, dedicated pipeline that runs only on the initial block of lines. You need to specify a regex to match which lines belong to the header. The metadata_operators then parse those lines into attributes which are automatically added to every log entry that follows.
To use this feature, you need to do three things:
- Enable the
filelog.allowHeaderMetadataParsingfeature gate:
# docker-compose.yml
services:
  otelcol:
    command:
      [
        --config=/etc/otelcol-contrib/config.yaml,
        --feature-gates=filelog.allowHeaderMetadataParsing,
      ]
- Set
start_at: beginningsince the header has to be read from the top. - Configure both the
headerrules and the mainoperatorspipeline.
Here’s the configuration to parse the headers in the sample log file:
# otelcol.yaml
receivers:
  filelog:
    include: [/var/log/jobs/*.log]
    start_at: beginning # required
    header:
      pattern: ^#
      metadata_operators:
        - type: key_value_parser
          delimiter: ": "
          pair_delimiter: "# "
Here’s what’s happening:
-
pattern: ^#says that any line starting with#belongs to the header. Those header lines are then passed through the pipeline ofmetadata_operators. -
The key_value_parser operator splits each header line into a key and value using
:as the separator, while#denotes the beginning of a new key/value pair.
These results in the following attributes on every log entry that follows in that file:
Attributes:
     -> Job-ID: Str(job-d8e8fca2)
     -> Job-Type: Str(nightly-billing-run)
     -> Executed-By: Str(scheduler-prod-1)
     -> Records-To-Process: Str(1500)
As you can see, the Job-ID and other header fields are now attached to the log record, providing invaluable context that would have otherwise been lost.
From here, you can process them further by promoting the header fields to resource attributes and aligning with OpenTelemetry semantic conventions.
How to avoid lost or duplicate logs
When the Collector restarts, log ingestion can easily go wrong if state is not preserved as you risk either re-ingesting old data or skipping over new logs. If you use start_at: beginning, the receiver will reread all your log files and create massive duplication. With start_at: end, you might miss any entries written while the Collector was down.
The way to solve this is with checkpointing. By configuring a storage extension, you instruct the filelog receiver to save its position in each file (the last read offset) to disk and pick up exactly where it left off.
A conventional approach is using the file_storage extension for this purpose:
# otelcol.yaml
extensions:
  file_storage:
    directory: /var/otelcol/storage

receivers:
  filelog:
    include: [/var/log/myapp/*.log]
    start_at: beginning
    # Link the receiver to the storage extension
    storage: file_storage

# ... processors, exporters

service:
  # The extension must be enabled in the service section
  extensions: [file_storage]
  pipelines:
    logs:
      receivers: [filelog]
      # ...
With the storage extension enabled, the receiver will:
- On startup, check the
/var/otelcol/storagedirectory for saved offsets. - Resume reading from the saved offset for any file it was tracking, ensuring no data is lost or duplicated.
- Periodically update the storage with its latest progress.
Checkpointing ensures that log collection is resilient to restarts, upgrades, and even crashes. It is a critical best practice for reliable log ingestion.
Handling log delivery failures gracefully
Checkpointing with a storage extension protects you during Collector restarts, but another common failure mode is when the receiver reads a batch successfully but fails to hand it off to the next stage.
This can happen if an exporter can’t reach its endpoint, or the memory limiter is refusing data. By default, the receiver will drop that batch of logs and move on to the next, causing silent data loss.
To prevent this, the receiver has a built-in mechanism to retry sending failed batches. When retry_on_failure is enabled, the receiver will pause, wait for a configured interval, and attempt to resend the exact same batch of logs. This process repeats with an exponential backoff until the batch is sent successfully or the max_elapsed_time is reached:
# otelcol.yaml
receivers:
  filelog:
    retry_on_failure:
      enabled: true
      # Wait 5 seconds after the first failure before the first retry.
      initial_interval: 5s
      # The longest the receiver will wait between retries is 30 seconds.
      max_interval: 30s
      # Give up trying to send a batch after 10 minutes.
      max_elapsed_time: 10m
By combining checkpointing with a robust retry policy , you’ll create a highly resilient log file ingestion pipeline that can withstand both Collector restarts and temporary downstream outages or throttling.
Deleting log files after processing
Some workflows call for processing a file once and then removing it to save space and avoid reprocessing. You can enable this with delete_after_read, which requires start_at: beginning:
# otelcol.yaml
receivers:
  filelog:
    include: [/var/log/archives/*.gz]
    start_at: beginning
    delete_after_read: true
You must need also enable the filelog.allowFileDeletion feature gate for this to work:
# docker-compose.yml
services:
  otelcol:
    command:
      [
        --config=/etc/otelcol-contrib/config.yaml,
        --feature-gates=filelog.allowFileDeletion,
      ]
Finally, ensure that the files are configured to be deletable and that the Collector service has enough permissions to delete the file. If permissions are insufficient, you will see a “could not delete” log record:
2025-10-08T06:42:03.973Z error reader/reader.go:278 could not delete {"resource": {"service.instance.id": "7c0daf0e-e625-4da8-9577-072606dce057", "service.name": "otelcol-contrib", "service.version": "0.136.0"}, "otelcol.component.id": "filelog", "otelcol.component.kind": "receiver", "otelcol.signal": "logs", "component": "fileconsumer", "path": "/var/log/myapp/app.log", "filename": "/var/log/myapp/app.log"}
Just be careful when enabling this setting as it deletes the files from disk permanently.
Handling log rotation seamlessly
Log files don’t grow indefinitely. Eventually, they’ll get rotated (or at least they should). The filelog receiver is built to handle common rotation patterns, such as app.log to app.log.1 automatically and without losing data.
Instead of relying on filenames alone, the receiver tracks each file using a unique fingerprint derived from the first few kilobytes of content. When rotation occurs, it recognizes that the original file has been renamed, finishes reading it, and then starts fresh from the beginning of the new app.log.
This behavior requires no additional configuration; it works out of the box, giving you reliable log ingestion even in environments with frequent rotations.
Reading compressed files
Many log rotation tools compress old logs to save disk space, producing files like access.log.1.gz. The filelog receiver can handle these seamlessly by decompressing them on the fly.
To make this work, you use the compression setting. This tells the receiver that some or all of the files it discovers may be compressed and need to be decompressed before parsing.
You have two main choices for the compression setting:
-
gzip: Treats all matched files as gzip-compressed. -
auto: Automatically detects compression based on file extension (currently.gz). This is the best option when a directory contains a mix of active, uncompressed logs and older, compressed ones.
For example, if your directory has both app.log (active) and app.log.1.gz (rotated and compressed), you can configure the receiver like this:
# otelcol.yaml
receivers:
  filelog:
    include: [/var/log/myapp/*]
    start_at: beginning
    # Automatically detect and decompress .gz files
    compression: auto
    operators:
      - type: regex_parser
        # ... your parsing rules
When working with compressed logs, there are two main things to keep in mind.
First, the receiver assumes that compressed files can only grow by appending new data. If a file is completely rewritten, for example by taking the original content and recompressing it together with new lines, the receiver may not handle it correctly.
Second, there’s the question of fingerprinting. By default, the receiver identifies files based on their compressed bytes. This works fine in most cases, but if files are renamed or moved it can cause confusion. To make identification more reliable, you can enable the filelog.decompressFingerprint feature gate. With this enabled, the fingerprint is calculated from the decompressed content.
# docker-compose.yml
services:
  otelcol:
    command:
      [
        --config=/etc/otelcol-contrib/config.yaml,
        --feature-gates=filelog.decompressFingerprint,
      ]
One caution: if you turn this feature on in an existing setup, the fingerprints will change. That means compressed files that were already read may be ingested again.
Performance tuning for high-volume environments
The OTel collector filelog receiver’s default settings are optimized for general use, but in production environments with hundreds of log files or very high throughput, you’ll likely need to tune its performance.
By default, the receiver tries to read from every matched file at once. On a system producing thousands of files, this can hog the CPU and quickly hit file handle limits.
The max_concurrent_files setting puts a cap on how many files are read at the same time. The default is 1024, but lowering this can keep your system from getting overwhelmed.
Another key setting is poll_interval, which controls how often the receiver checks for new files and new log lines. The default is 200ms which means logs show up almost immediately, but CPU use goes up because the filesystem is scanned more often.
For less critical logs or resource-constrained environments, bumping this to 1s or even 5s can be a good trade-off as it’ll reduce the polling overhead with only a negligible impact on observability for most use cases.
Finally, unusually large log entries are guarded against through the max_log_size setting. It defines the largest allowed log entry, so that anything bigger gets truncated. The default is 1MiB, which is a sensible default for most workloads.
# otelcol.yaml
receivers:
  filelog/k8s_pods:
    include: [/var/log/pods/*/*/*.log]
    max_concurrent_files: 200
    poll_interval: 1s
    max_log_size: 2MiB
Enforcing log file order
Most of the time, the order in which log files are ingested doesn’t matter. But some systems produce logs as a series of sequential files where processing order is critical.
By default, the filelog receiver reads all matching files concurrently, which means you could end up processing them out of sequence. The ordering_criteria setting solves this by enforcing a strict order when reading files.
For example, given a set of log files with the following conventions:
batch-run-001.log
batch-run-002.log
batch-run-003.log
# otelcol.yaml
receivers:
  filelog/batch_logs:
    include: [/var/log/batch-runs/batch-run-*.log]
    start_at: beginning
    ordering_criteria:
      top_n: 1
      # Extract the sequence number from the filename
      regex: batch-run-(?P\d+)\.log
      # Sort files by the sequence number as a number, not a string
      sort_by:
        - regex_key: seq_num
          sort_type: numeric
          ascending: true
With this setup, the receiver will discover all files matching batch-run-*.log, extract the sequence number from each filename, and sort the files numerically in ascending order by that sequence.
The top_n property determines how many files will be tracked after applying the ordering criteria. With top_n: 1, only the first file (batch-run-001.log) will be tracked and ingested into the pipeline.
Filelog receiver tips and best practices
When troubleshooting the filelog receiver, a few issues come up again and again. Here’s how to diagnose and fix them quickly:
Log files are not being watched
When the Collector starts watching a file for log entries, you’ll see a log like this in its output:
2025-10-09T08:47:05.574Z info fileconsumer/file.go:261 Started watching file {...}
If you don’t see this message, or if you see the log below, it means that the receiver hasn’t picked up any files yet:
2025-10-09T09:25:20.280Z warn fileconsumer/file.go:49 finding files {..., "error": "no files match the configured criteria"}
Start by double-checking your include, exclude, and exclude_older_than settings to make sure your file patterns actually match the files you expect.
Next, verify that the Collector process has permission to access both the files and their parent directories. Missing directory-level permissions are one of the most common reasons files aren’t discovered or watched.
Files are watched but no log lines are read
If you can see “Started watching file” messages but no logs are being collected, the most common cause is the start_at setting. By default, it’s set to end, which tells the receiver to start reading only new lines appended after the Collector starts.
When you’re testing with an existing file that isn’t actively being written to, this means nothing will appear. To read the entire file from the start, set start_at to beginning:
# otelcol.yaml
receivers:
  filelog:
    start_at: beginning
This ensures the receiver processes all existing content the first time the file is discovered.
Regular expression doesn’t match log lines
If your logs aren’t being parsed correctly, the issue is usually with your regular expression. When this happens, the Collector often logs an error like:
2025-10-09T09:32:14.949Z error helper/transformer.go:154 Failed to process entry {"resource": {"service.instance.id": "f8ec2efd-16e9-44ad-9ed2-9f406e46719f", "service.name": "otelcol-contrib", "service.version": "0.136.0"}, "otelcol.component.id": "filelog", "otelcol.component.kind": "receiver", "otelcol.signal": "logs", "operator_id": "regex_parser", "operator_type": "regex_parser", "error": "regex pattern does not match", "action": "send", "entry.timestamp": "0001-01-01T00:00:00.000Z", "log.file.name": "batch-run-001.log"}
Before adjusting your Collector config, test the regex outside of it using a tool like Regex101. Make sure to select the Golang flavor so it behaves the same way as the Collector’s regex engine.

If you’re not seeing this error but your regex still isn’t working, check whether the on_error parameter is set to one of the _quiet modes. Those values suppress operator errors unless the Collector log level is set to DEBUG.
Common causes of regex mismatches include invisible spaces or tabs, missing anchors (^ or $), incorrect escaping, or small format differences between your log and your pattern. Double-check these details before investigating further.
Logs are duplicated after restart
If you notice duplicate logs appearing after the Collector restarts, it usually means the receiver isn’t remembering where it left off. To fix this, enable a storage extension so the filelog receiver can checkpoint its position in each file.
This allows the receiver to resume reading exactly where it stopped, preventing both data loss and duplication. Without it, the receiver will reread entire files from the start after every restart.
Final thoughts
The filelog receiver in OpenTelemetry is an essential bridge between traditional file-based logging (often with unstructured data) and the world of modern, structured observability.
By mastering its core concepts of discovery, parsing with operators, and checkpointing, you can build a reliable log ingestion pipeline for any service that writes its logs to a file.
Once you’ve transformed your raw text logs into well-structured OpenTelemetry data, the full observability ecosystem opens up. You can enrich, filter, and route them to any backend that speaks OTLP.

For a faster path from collecting telemetry to insight, consider using Dash0, an observability platform purpose-built for OpenTelemetry data. Try it out today with a free 14-day trial.