
Three months ago, I spent an embarrassing amount of time optimizing a complex Redis caching layer – tweaking expiration strategies, adding compression, even experimenting with different serialization formats. The performance improvements were modest at best. Then, almost accidentally, I discovered that a single line of string processing code was consuming 40% of our CPU cycles.
The culprit? Using gsub instead of tr for simple character replacement.
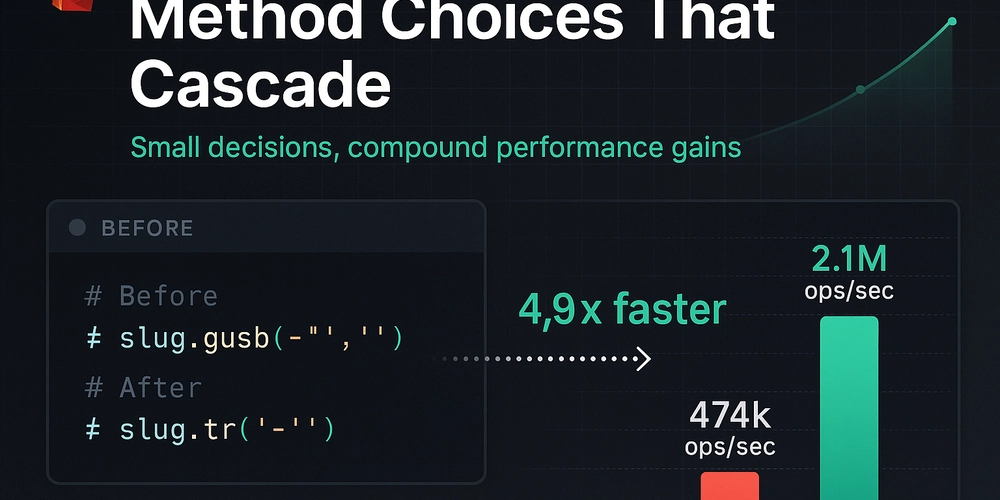
# What we had (processing thousands of slugs per request)
slug.gsub('-', ' ')

# The simple fix that changed everything
slug.tr('-', ' ')
Here’s what that looked like in our benchmarks:
require 'benchmark/ips'

SLUG = 'high-performance-web-apps'

Benchmark.ips do |x|
  x.report('gsub') { SLUG.gsub('-', ' ') }
  x.report('tr')   { SLUG.tr('-', ' ') }
  x.compare!
end

# String#tr: 2,121,629.8 i/s
# String#gsub: 474,970.5 i/s - 4.90x slower
The difference isn’t subtle – we’re talking about a 5x performance gap. When you’re processing thousands of these conversions per request, that compounds fast.
This experience taught me something uncomfortable: sometimes the biggest performance wins hide in the smallest details. While I was architecting elaborate caching strategies, the real bottleneck was a basic method choice.
The count/length/size confusion that keeps biting people
Rails developers run into this trap constantly, and I’ve done it myself more times than I care to admit:
# This will load every single record into memory
users.length  # SELECT * FROM users (!!!)

# This hits the database with COUNT(*)
users.count   # SELECT COUNT(*) FROM users

# This tries to be smart about it
users.size    # Uses COUNT(*) if not loaded, length if already in memory
I watched a colleague’s dashboard go from snappy to timing out because they assumed .length and .count were interchangeable. The users table had grown to 800,000 records. That .length call suddenly meant loading nearly a million ActiveRecord objects just to count them.
The frustrating part? This knowledge exists in every Rails developer’s head somewhere. But under deadline pressure, these details slip through code review.
N+1 queries have evolved (and gotten sneakier)
Everyone knows about the classic N+1 problem:
posts = Post.all
posts.each do |post|
  puts post.comments.count  # N database hits
end
But modern applications create more sophisticated variants. Last year I debugged a GraphQL API where the query pattern looked innocent enough, but nested resolvers were creating exponential query growth. Not N+1, but N×M×P queries spiraling into thousands of database hits.
The textbook solution is includes, but that brings its own problems:
# Seems right, but can be a memory bomb
Post.includes(:comments, comments: [:author, :reactions])

# Better for large datasets - be selective
Post.includes(:comments)
    .where(comments: { status: 'approved' })
    .limit(20)
Here’s something the Rails guides don’t emphasize enough: includes can actually make things worse for large datasets. When you’re joining tables with hundreds of thousands of rows, that LEFT OUTER JOIN might generate a cartesian product that exhausts your memory before Rails even starts instantiating objects.
For read-heavy endpoints, I’ve started reaching for PostgreSQL’s JSON aggregation instead:
-- Skip ActiveRecord entirely for heavy read operations
SELECT categories.*,
       json_agg(
         json_build_object(
           'id', items.id,
           'name', items.name,
           'price', items.price
         ) ORDER BY items.name
       ) as items_json
FROM categories
LEFT JOIN items ON items.category_id = categories.id
GROUP BY categories.id;
You lose ActiveRecord’s convenience, but gain 50-90% reduction in memory usage. Sometimes that trade-off makes sense.
Database indexes that actually match your queries
Adding indexes feels straightforward until you start looking at your actual query patterns. Many developers create single-column indexes without considering how their WHERE clauses work together.
Here’s a real example from an e-commerce platform:
-- What most people start with
CREATE INDEX idx_orders_user_id ON orders(user_id);
CREATE INDEX idx_orders_created_at ON orders(created_at);

-- What actually matches the query pattern
CREATE INDEX idx_orders_user_date_status
  ON orders(user_id, created_at DESC, status)
  INCLUDE (total_amount, shipping_address_id);
That INCLUDE clause creates a covering index – PostgreSQL can satisfy the entire query without touching the main table. For their most common dashboard query, this cut I/O operations by 73%.
But here’s where it gets interesting: PostgreSQL’s query planner is cost-based, not rule-based. It looks at your data distribution to choose between available indexes. I’ve seen perfectly good indexes get ignored because the table statistics were stale.
-- Force a statistics update after major data changes
ANALYZE orders;

-- For skewed data distributions, increase sample size
ALTER TABLE orders ALTER COLUMN user_id SET STATISTICS 1000;
That last line can be a game-changer. The default statistics target is 100 samples, but if you have columns where some values are much more common than others (like user_id where power users have thousands of orders), increasing this helps the planner make better choices.
Caching strategies that don’t blow up in production
After debugging enough cache-related outages, I’ve learned that caching isn’t really about storing data temporarily. It’s about managing state synchronization across distributed systems while keeping things roughly consistent.
The approach that’s worked best for me involves multiple layers with different consistency guarantees:
Browser caching for immutable assets:
// Webpack config for long-term caching
output: {
  filename: '[name].[contenthash].js',
  chunkFilename: '[id].[contenthash].chunk.js'
}
Redis for application state:
The pattern I keep coming back to handles the cache stampede problem – when your cache expires during a traffic spike and every request triggers an expensive recomputation:
class CacheManager
  def fetch_with_grace(key, ttl: 3600, grace_period: 60, &block)
    value, remaining_ttl = redis.multi do |r|
      r.get(key)
      r.ttl(key)
    end

    # Serve stale content while recomputing in background
    if value && remaining_ttl < grace_period
      Thread.new { recompute_and_store(key, ttl, &block) }
      return JSON.parse(value)
    end

    return JSON.parse(value) if value

    # First miss - compute with distributed lock
    redis.with_lock("lock:#{key}", timeout: 10) do
      recompute_and_store(key, ttl, &block)
    end
  end
end
This pattern has prevented numerous outages. Instead of having 100 concurrent requests all trying to regenerate the same expensive data, one request does the work while others get slightly stale content.
Fragment caching that actually works:
Rails’ Russian Doll caching is underused, probably because it requires thinking about cache dependencies upfront:
<% cache ['v1', @product, @current_user&.cache_key] do %>
   class="product">
    <%= @product.name %>

    <% cache [@product, 'pricing'] do %>
      <%= render 'pricing_info', product: @product %>
    <% end %>

    <% @product.variants.each do |variant| %>
      <% cache variant do %>
        <%= render 'variant', variant: variant %>
      <% end %>
    <% end %>

<% end %>
When a single variant updates, only that fragment invalidates. For a product with 50 variants, that’s 2% cache invalidation instead of 100%. The 'v1' version string lets you bust all fragments when you deploy template changes – without it, you’ll serve mixed HTML from different code versions.
Making CI/CD faster (the productivity multiplier everyone ignores)
Every minute you shave off CI is a minute returned to every developer, multiple times per day. The compound effect adds up to hours per week per person.
Docker layer optimization:
FROM node:18-alpine AS base

# System dependencies change rarely - cache these layers
RUN apk add --no-cache python3 make g++

# Dependencies change occasionally
WORKDIR /app
COPY package*.json ./
RUN npm ci --only=production

# App code changes frequently - put this last
COPY . .
RUN npm run build
But the real win is using BuildKit’s cache mounts:
RUN --mount=type=cache,target=/root/.npm \
    npm ci --only=production
This persists npm’s cache between builds. Three-minute dependency installs become 20-second cache hits.
Parallel test execution:
The trick isn’t just splitting tests – it’s ensuring they don’t interfere:
# config/database.yml
test:
  database: myapp_test<%= ENV['TEST_ENV_NUMBER'] %>

# Each process gets its own schema
$ parallel_rspec spec/
We went from 45-minute test suites to 12 minutes with four parallel processes.
Dealing with flaky tests:
Rather than letting flaky tests poison your entire suite, quarantine them:
// jest.config.js
module.exports = {
projects: [
{
displayName: 'stable',
testMatch: ['/src/**/*.test.js '],
testPathIgnorePatterns: ['/src/**/*.flaky.test.js ']
},
{
displayName: 'quarantine',
testMatch: ['/src/**/*.flaky.test.js '],
retries: 3
}
]
};
Flaky tests run separately with retries. They don’t block deployments, but they also don’t get ignored.
Performance budgets as guardrails
Teams that maintain good performance over time have embedded performance constraints into their development process:
{
  "bundles": [
    {
      "name": "main.js",
      "maxSize": "300 KB",
      "warning": "250 KB"
    }
  ],
  "metrics": {
    "firstContentfulPaint": 1500,
    "largestContentfulPaint": 2500,
    "totalBlockingTime": 200
  }
}
Every pull request runs against these budgets. Exceed them and the build fails. Want to add that 50KB analytics library? Fine, but what are you removing to stay under budget?
Some numbers from actual systems
E-commerce platform (last year):
- Switched from individual Redis keys to hash data structures
- Added covering indexes for product catalog queries
- Implemented fragment caching with 5-minute TTL
- Result: 47ms → 12ms 95th percentile response time
B2B SaaS dashboard:
- Replaced nested GraphQL N+1 patterns with DataLoader
- Set up database connection pooling via PgBouncer
- Moved CI from Jenkins to GitHub Actions with build caching
- Result: 3.2s → 340ms API response time, 45-minute → 8-minute builds
Technologies worth watching
eBPF for production observability:
Being able to trace performance issues in production with near-zero overhead changes how you debug problems. No more “works fine in staging” mysteries.
WASM at the edge:
For compute-intensive operations, running WebAssembly modules at edge locations gives you 95% of native performance with 50x faster cold starts than containers.
Ruby’s YJIT compiler:
If you’re on Ruby 3.2+, enabling YJIT can improve performance by 15-40% with a one-line configuration change.
Where to start
If this resonates but feels overwhelming, pick one area:
Week 1: Add basic monitoring. Get 95th percentile response times on a dashboard you actually look at.
Week 2: Find your worst N+1 query and fix it. Use something like rack-mini-profiler to spot them.
Week 3: Add one performance test to CI – just your most critical user path.
Week 4: Set up performance budgets for your main JavaScript bundle.
Performance work compounds. Minor improvements stack up over time, but only if you measure consistently and fix regressions quickly.
The teams that build fast applications treat performance as a feature, not an afterthought. They measure continuously, optimize incrementally, and never assume their systems will stay fast without attention.
Start small, measure everything, and remember that the most impactful optimizations often hide in the details everyone takes for granted.